Indien und China im Vergleich: Unterschied zwischen den Versionen
Aus RSG-Wiki
Berny1 (Diskussion | Beiträge) (Die Seite wurde neu angelegt: „<iframe src="http://LearningApps.org/watch?v=p1p8zafcj" style="border:0px;width:100%;height:700px" webkitallowfullscreen="true" mozallowfullscreen="true"></iframe>“) |
Berny1 (Diskussion | Beiträge) |
||
| Zeile 1: | Zeile 1: | ||
| + | == Relief == | ||
| + | |||
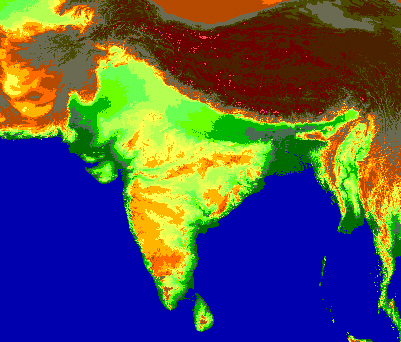
| + | <br><center>[[Bild:Ind11.jpg]]</center><br> | ||
| + | ''Bildverweis: B. Heim, Karte erstellt mit Programm der RSG-Programmers-Group 1995 aus den GTOPO30-Daten des US-Geological Survey'' <br> | ||
| + | |||
| + | <table cellpadding="2" cellspacing="2" border="0" | ||
| + | style="text-align: left; width: 100%;"> | ||
| + | <tr> | ||
| + | <td style="vertical-align: top; background-color: rgb(51, 102, 255); width: 1%;"><br> | ||
| + | </td> | ||
| + | <td style="vertical-align: top;"> | ||
| + | '''Arbeitsaufgabe'''<br> | ||
| + | '''Geben Sie eine Reliefgliederung Indiens''' | ||
| + | |||
| + | <br> | ||
| + | </td> | ||
| + | </tr> | ||
| + | </table> | ||
| + | |||
| + | <table cellpadding="2" cellspacing="2" border="0" | ||
| + | style="text-align: left; width: 100%;"> | ||
| + | <tr> | ||
| + | |||
| + | <td style="vertical-align: top; background-color: rgb(51, 102, 255); width: 1%;"><br> | ||
| + | </td> | ||
| + | <td style="vertical-align: top;"> | ||
| + | '''Arbeitsaufgabe'''<br> | ||
| + | '''Ordne den markierten Nadeln Reliefeinheiten zu!''' | ||
| + | |||
| + | <br> | ||
| + | </td> | ||
| + | </tr> | ||
| + | </table> | ||
| + | |||
| + | |||
<iframe src="http://LearningApps.org/watch?v=p1p8zafcj" style="border:0px;width:100%;height:700px" webkitallowfullscreen="true" mozallowfullscreen="true"></iframe> | <iframe src="http://LearningApps.org/watch?v=p1p8zafcj" style="border:0px;width:100%;height:700px" webkitallowfullscreen="true" mozallowfullscreen="true"></iframe> | ||
| + | |||
| + | |||
| + | == Klima == | ||
| + | |||
| + | |||
| + | |||
| + | <center> | ||
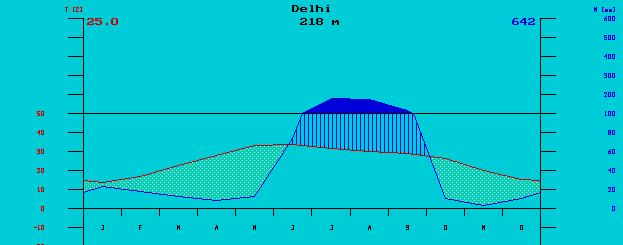
| + | [[Bild:klidelhi.jpg]]<br> | ||
| + | ''Bildverweis: B. Heim Klimadiagramm erstellt mit eigenem Programm Geograph-Klima 1988''</center> | ||
| + | <br> | ||
| + | |||
| + | <table cellpadding="2" cellspacing="2" border="0" | ||
| + | style="text-align: left; width: 100%;"> | ||
| + | <tr> | ||
| + | <td style="vertical-align: top; background-color: rgb(51, 102, 255); width: 1%;"><br> | ||
| + | </td> | ||
| + | <td style="vertical-align: top;"> | ||
| + | '''Arbeitsaufgabe'''<br> | ||
| + | '''Beschreiben Sie das Klima in Delhi im Verlauf eines Jahres anhand obenstehenden Diagrammes'''<br> | ||
| + | |||
| + | <br> <br> | ||
| + | </td> | ||
| + | </tr> | ||
| + | </table> | ||
Version vom 15. September 2013, 15:19 Uhr
Relief

Bildverweis: B. Heim, Karte erstellt mit Programm der RSG-Programmers-Group 1995 aus den GTOPO30-Daten des US-Geological Survey
|
Arbeitsaufgabe
|
|
Arbeitsaufgabe
|
[ LearningApps.org is not an authorized iframe site ]
Klima
|
Arbeitsaufgabe
|


