Datei:Sahel rainfall timeseries de.svg
Aus RSG-Wiki

Größe dieser Vorschau: 530 × 221 Pixel.
Volle Auflösung (SVG-Datei, Basisgröße: 1.200 × 500 Pixel, Dateigröße: 21 KB)
W3C-validity not checked.
Beschreibung
| Beschreibung |
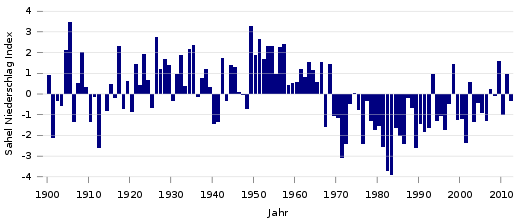
English: More than a century of rainfall data in the Sahel show an unusually wet period from 1950 until 1970 (positive index values), followed by extremely dry years from 1970 to 1990 (negative index values). From 1990 until present rainfall returned to levels slightly below the 1898–1993 average, but year-to-year variability was high.
Deutsch: Abweichung der Sahelzonen-Niederschlagsmenge vom Mittelwert des 20. Jahrhunderts.Der Zeitraum 1950-1970 war ungewöhnlich feucht(positive Werte), der Zeitraum 1970 bis 1990 extrem trocken (negative Werte). |
| Datum | |
| Quelle | Own work, based on JISAO data |
| Urheber | Benedikt.Seidl |
| Andere Versionen | Image:Sahel_rainfall_timeseries.gif |
Lizenz
| Ich, der Urheberrechtsinhaber dieses Werkes, veröffentliche es als gemeinfrei. Dies gilt weltweit. In manchen Staaten könnte dies rechtlich nicht möglich sein. Sofern dies der Fall ist: Ich gewähre jedem das bedingungslose Recht, dieses Werk für jedweden Zweck zu nutzen, es sei denn, Bedingungen sind gesetzlich erforderlich. |
Quellcode
download the data:
#!/usr/bin/python
# -*- coding: utf-8 -*-

import urllib

def main():
    url = "http://jisao.washington.edu/data_sets/sahel/"
    line_before = "        +0    1    2    3    4    5    6    7    8    9\n"
    data = urllib.urlopen(url)
    for line in data:
        if line == line_before:
            for ten_years in data:
                ten_years = ten_years.strip()
                if ten_years == "":
                    break
                elements = map(int, ten_years.split())
                year_start, rain_data = elements[0], elements[1:]
                for year, rain_data in enumerate(rain_data, year_start):
                    print("{0} {1}").format(year, rain_data)

if __name__ == '__main__':
    main()
gnuplot:
#!/usr/bin/gnuplot

set terminal svg enhanced size 1200 500 fname "DejaVuSans" fsize 18
set output "Sahel_rainfall_timeseries_de.svg"

set noborder
set key reverse right bottom
set nokey
set xtics nomirror out
set ytics nomirror out
set ylabel 'Sahel Niederschlag Index'
set yrange [-4:4]
set xlabel 'Jahr'
set style line 12 lc rgb '#cccccc'
set grid ytics front linestyle 12
set xtics ("1900" 0, "1910" 10, "1920" 20, "1930" 30, "1940" 40, "1950" 50, "1960" 60, "1970" 70, "1980" 80, "1990" 90, "2000" 100, "2010" 110, "2020" 120)

set style data histogram
set style histogram cluster gap 0.2
set style fill solid noborder
set boxwidth 0.9

plot 'rain.data' u ($2/100) ti col lc rgb '#000080'
execute:
python rain.py > rain.data && gnuplot rain.dem
Dateiversionen
Klicke auf einen Zeitpunkt, um diese Version zu laden.
| Version vom | Vorschaubild | Maße | Benutzer | Kommentar | |
|---|---|---|---|---|---|
| aktuell | 11:32, 9. Jul. 2014 | | 1.200 × 500 (21 KB) | Benedikt.Seidl | update 2013 |
Dateiverwendung
Die folgenden 2 Seiten verwenden diese Datei: